1) File management, preparation, and metadata [Total: 2 marks].
- Open the ZIP file (ASTGTM2_N48W125.zip).
- Extract ASTGTM2_N48W125_dem_DEM.tif to D:\Temp\355-1. TIFs are a type of image that is often used to store single-band remote-sensed data, such as Digital Elevation Models. Delete the archive.
- Open TerrSet. In TerrSet Explorer, create a new project. The working folder is D:\Temp\355-1. Name this project: [your SFU computing ID]-355-1 (for example, mine would be called ashashan-355-1). Set a resource folder to the same directory.
- Import the .tif by: file>import>government/data provider formats/GEOTIFF\TIFF. Use the default output name. Once imported, close the image window. Refresh the file explorer, and your new .RST file should appear.
- In Windows Explorer, go to D:\Temp\355-1. Find the new .rdc file, right-click and select ‘edit with notepad++’. Read the metadata very carefully. Which coordinate system does this raster use? (0.5 marks).
- ASTGTM2_N48W125_dem uses “Geographic Coord. System EPSG Code : 4326 : WGS_84 = Idrisi Latlong.ref” coordinate system
- Find the same metadata in TerrSet Explorer. What is the resolution? (0.5 marks)
What are the units of measurement (i.e., what do the pixel values represent?) (0.5 marks) What is the extent (max and min coordinates)? (0.5 marks)- For ASTGTM2_N48W125_dem:
- Resolution: (x 0.00027777778) * (y 0.00027777778)
- Units of measurments: the unit of elevation is unspecified in the .rdc metadata file, but is stated to be in vertical metres in the additional information that comes in the .zip file (README.pdf).
- Extent for x: -125.0001389 to -123.9998611 (or over 1.0002778)
- Extent for y: 47.9998611 to 49.0001389 (or over 1.0002778)
- For ASTGTM2_N48W125_dem:
2) Basic map composition. [Total: 3 marks]
- Open the DISPLAY Launcher dialogue and open ASTER_N48W125. Use a non-default palette to display; find ‘Quant_kilimanjaro’ in the ‘Palette File’ pick list. Also display the same raster file using a qualitative colour palette. Why is a qualitative colour palette not appropriate for this DEM? (1 mark)
- Since DEM is Raster, qualitative is giving each pixel a different colour, as if they’re discrete shapes, making it unable to see the transition of different elevations. (DEM gives ranges of values, not discrete objects that qualitative colour palettes are meant for. A quantitative colour palette should instead be used.)
- Since DEM is Raster, qualitative is giving each pixel a different colour, as if they’re discrete shapes, making it unable to see the transition of different elevations. (DEM gives ranges of values, not discrete objects that qualitative colour palettes are meant for. A quantitative colour palette should instead be used.)
- Copy the image using Windows Print Screen (Print Screen key in your keyboard), crop it with MS Paint so that the window borders are not visible, and paste in your lab answer sheet. Using MS Word, add a descriptive title and a description that introduces the meaning of the palette and the context. (2 marks, +1 bonus mark if you can identify where this is, and include it in your map title).
Digital Elevation Model of Southern Vancouver Island Area under a Qualitative Colour Palette
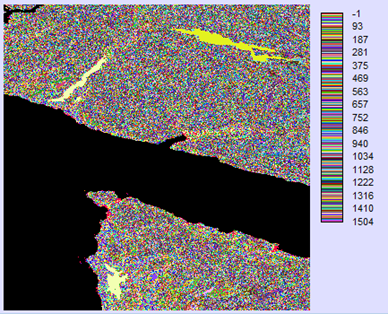
A digital elevation model of the southern coast of Vancouver Island, shown under a qualitative colour palette to show the results of using the wrong kind of colour palette (qualitative) for raster data and to depict how unreadable it is.
3) Vector data and raster data are two major GIS data formats. Compare the differences by answering the following questions a) and b). [Total: 5 marks]
- Describe the key differences between raster and vector data in your own words.
(1 mark)- Raster data shows the transition of information/ data over a given region (a range of values).
- Vector data gives the information for discrete shapes (points, lines and polygons).
- Give an example of a GIS problem where raster is better, explain why. Give an example of a GIS problem where vector is better, explain why. (4 marks)
- Raster: Say you’re a researcher studying an endangered frog in the amazon and notice they tend to live in the transition of 2 different biomes. You wish to map this habitual zone but know there is no clear line between the 2 biomes, but instead a slow transition of one biome to the other. Raster information is needed to correctly display this ecosystem of the endangered frog; Vector data would instead mark each biome as different regions with set lines to define the boarder, not accurately showing the habitat of the frog
- Vector: Imagine you are a city planner looking at to make a digital version of the property lands in central Vancouver. Vector data is needed to mark the different properties of different owners since each property is clearly defined as a shape with set borders.
4) Re-examine the metadata for the ASTER DEM using TerrSet Explorer. [Total: 2 marks]
- What are the minimum and maximum values in this image? (1 mark)
- Minimum: -1 metre
- Maximum: 1504 metres
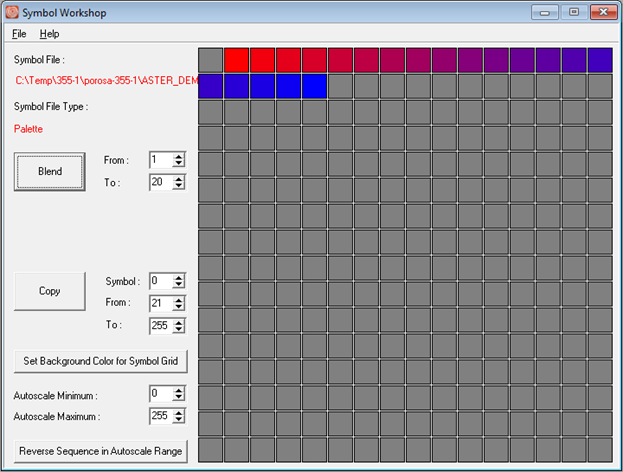
- Create a new colour palette: Open Symbol Workshop and create a new palette file and name it as “ASTER_DEM.smp”. Assign gray color for 0 and greater than 20. Assign the colour red to value 1 and blue to value 20. Use Blend button to blend values between 1 and 20. Copy the Symbol Workshop window using Windows Print Screen (Print Screen key in your keyboard) and paste the output window in your lab answer sheet. (1 mark)
5) Apply the new ASTER_DEM.smp palette to your ASTER_N48W125.rst image. [Total: 6 marks]
- Add a Title, North Arrow, and Scale Bar. Change the text font, colour, and size. Copy the Image using Windows Print Screen (Print Screen key in your keyboard), crop it in MS Paint, and paste the output window in your lab answer sheet. (3 marks)
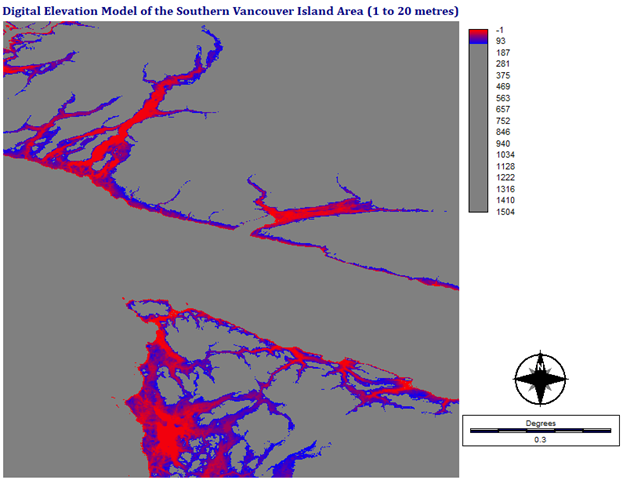
- What does the resulting map show? What is wrong with this? How might this be valuable? (3 marks)
- The map shows the range of elevation from 1 to 20 metres.
- What’s wrong with this map is how the legend extends to 1504 metres, far beyond the range of symbols. Because of this, it is hard to notice a difference of elevation between 1 and 20m.
- This map could be useful to find the areas of land that between 1 and 20 metres around southern Vancouver Island. This information could be used, for example, to determine what regions would be affected by rising sea levels.
6) Compare the file types used in TerrSet and ESRI ArcGIS by answering the following questions. [Total: 5 marks]
- What are the roles of TerrSet raster group files (.rgf), vector link files (.vlx), and environment files (.env)? (1.5 marks)
- .rgf files contain the raster data used in terrset
- .vlx files contain the vector data used in terrset
- .env files contain the other visual elements behind the map (the underlaying map, scale, etc.)
- What is the difference between an ESRI shapefile and an ESRI GRID? (1 mark)
- ESRI shapefile contain vector data for ArcMap while ESRI GRID contains raster data for ArcMap.
- Write 150 to 200 words on a project idea for your 355 final project. What is the GIS problem that you would like to investigate, and how might you do this? (2.5 marks)
- I think it could be interesting to look at the areas that might be affected by rising sea level around the lower mainland, due to climate change. This could be done by obtaining elevation data of the lower mainland and combining that with information from the literature that gives estimated levels of sea level rise for various time periods in the future and with different levels of effort taken to address sea level rise. The final project can be quite useful to either help motivate people to take action against climate change, (or if there is minimal land affected by sea level rise, it could tell us that we should focus our adaptive strategies elsewhere) by showing them the amount of land and homes that may be flooded over with the rising sea.
7) Post the answers to these question on a single post on your website.
- Make sure you have marked which question you are answering, adjusted the image sizes, the fonts; there should be consistency. Title this subpage or section the title of this lab above. [Total: 2 marks]

 Geog 355